Knowing phytic P levels in diets opens up opportunities for incremental gains
Published Thursday, 15th March 2018Thanks to latest advancements in NIR, this technology can now be used to measure phytate levels in raw materials and finished feeds.
Having a better understanding of phytate levels enables you to optimise the dose of phytase (maximising the use of P-replacement from phytase), subsequently maximizing the release of all the inherent nutrition from feed (protein, minerals, P etc.)
Phytate is present in all plant-based feedstuffs, and binds with dietary proteins and minerals, reducing digestibility and utilization of important nutrients. Four or five years ago, people were using phytase to release phosphorus from phytate.
Today, with improved understanding of phytate anti-nutritive effects and the ability to measure phytate levels in the diet, we can now formulate diets based on more complete phytate destruction and the provision of nutrients beyond phosphorous.
What does this mean?
Moving beyond first generation phytases towards more effective phytases for maximized phytate destruction
Potential to increase phytase dose where analysed phytic p levels have shown the opportunity for incremental gains
Potential to reduce costs whilst maintaining performance or potential for improved performance at a lower cost
Figure 1: Potential of phytases on a diet with 0.25 Phytic P levels
Traditionally, first generation phytases were applied to release 0.1 phosphorus from phytic P. The graph clearly shows that with this approach a lot of phytic P is left unavailable in the diet therefore missing out on its inherent value.
New generation phytases at 500 FTU can move to 0.15 releasing more phytic P but still leaves a lot of untapped potential in the feed.
By knowing phytic P levels in diets nutritionists know what possibilities are open to them for phytase application and how far they can go with their phytase dose. When a nutritionist can confidently increase their phytase dose, incremental improvements in performance can be seen and money can be saved (figure 2).
Figure 2: Optimising the P matrix from phytase can lead to reduced cost of feed formulation. Moving from 500FTU to 1000FTU saves $2/tonne proving Quantum Blue is cost effective at higher doses.
Our Feed Quality Service utilises our expertise in Near Infra-Red spectroscopy to provide you with accurate predictions of the phytate level within your raw materials and finished feeds, offering advice on how to extract even more value from your phytase.
Our Global Technical Manager Gilson Gomes talks about our Feed Quality Service
Latest news
Stay ahead with the latest news, ideas and events.
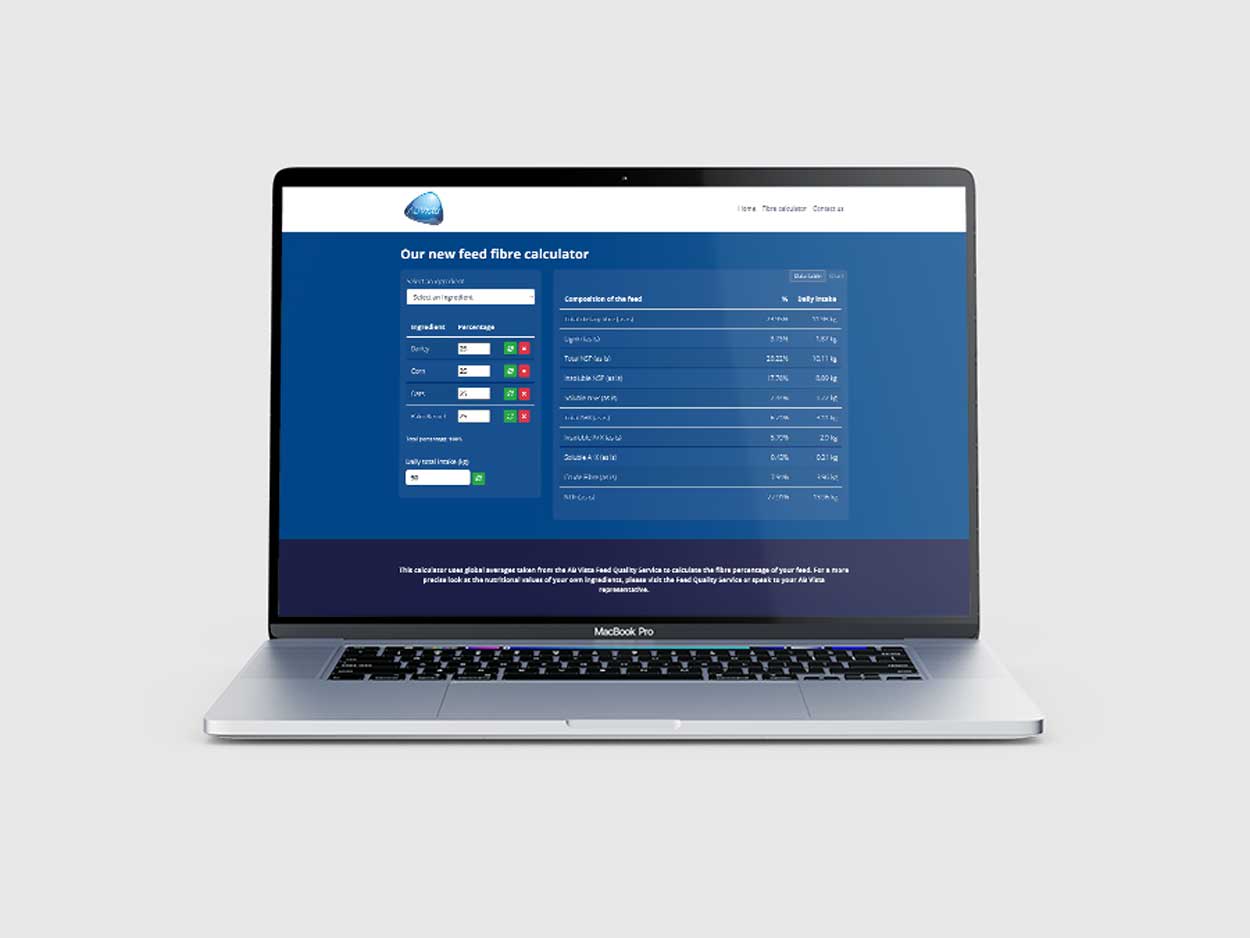
Online Feed Fibre Calculator
Calculate the percentage of dietary fibre in your feed
Our calculator is designed for nutritionists and uses averages of global raw materials to calculate the dietary fibre content (plus other more in-depth fibre parameters) of finished animal feed. These parameters are available within AB Vista’s Dietary Fibre analysis service (part of our NIR service).
Sign up for AB Vista news
A regular summary of our key stories sent straight to your inbox.
SUBSCRIBE© AB Vista. All rights reserved 2025
Website T&Cs Privacy & Cookie Policy Terms & Conditions of Sale University IDC policy Speak Up Policy


