


- HOME
- SPECIES
Featured
Higher dietary nutrient contributionsWe have developed an enzyme application strategy called Maximum Matrix Nutrition, which capitalises on the properties of Quantum Blue, an enhanced E. coli phytase with a high affinity for phytate, in addition to a thermostable and inhibitor-resistant xylanase, Econase XT.
Improved monitoring of raw materials and finished feedsOur range of NIR Services aims to provide a convenient and cost-effective ability to analyse feeds and raw materials, using calibrations, process control, support and analytical tools.
Stimulating the microbiome to improve productivityIncreasing understanding of fibre is presenting a new perspective on the valuable role it can play in gut health and therefore, within performance-enhancing nutritional strategies.
EXPERTS IN ANIMAL NUTRITION FOR THE ANIMAL FEED INDUSTRY
- PRODUCTS
All Products

Quantum Blue works to unlock all six phosphorus molecules, releasing inositol and valuable nutrients that would otherwise stay bound to phytate.
INDUSTRY-LEADING PRODUCTS TO MAXIMISE ROI
- SERVICES
- INSIGHTS


A Guide to NIR: Understanding NIR spectra
Published Monday, 16th July 2018
In the third article in our new series exploring Near-Infrared Spectroscopy (NIR), we explore the information that can be extracted from NIR spectra.
NIR spectra are notoriously difficult to interpret mainly due to broad, overlapping and non-specific nature of the absorption bands. Nevertheless, there is a wealth of information hidden in the peaks and troughs of these spectra, to the extent that they are called finger prints. A great deal can be learned, with some basic understanding of NIR spectral features. This skill is also useful in many situations, ranging from trouble shooting through to classification and outlier detection.
Section 1: Oil
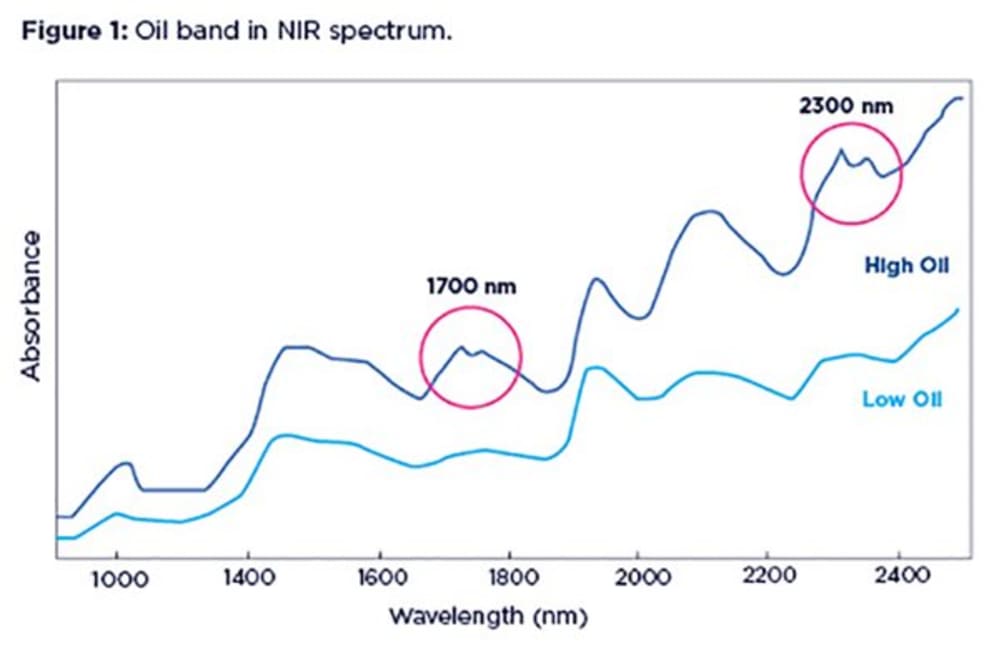
Oil (or fat) has very characteristic absorption bands that are easily identified in NIR spectra, especially when oil concentration is high in a sample. Oil bands appear as distinct duplets at two regions in the NIR range: the region around 1700 nm and that around 2300 nm. The left branch of the duplet is normally more prominent. At lower concentrations of oil, the duplet at 1700 nm tends to get smoothed out, turning into a little lump.
An example below shows spectra form two agricultural samples one with high oil content (blue line) and the other one with very little oil (green line).
Section 2: Starch
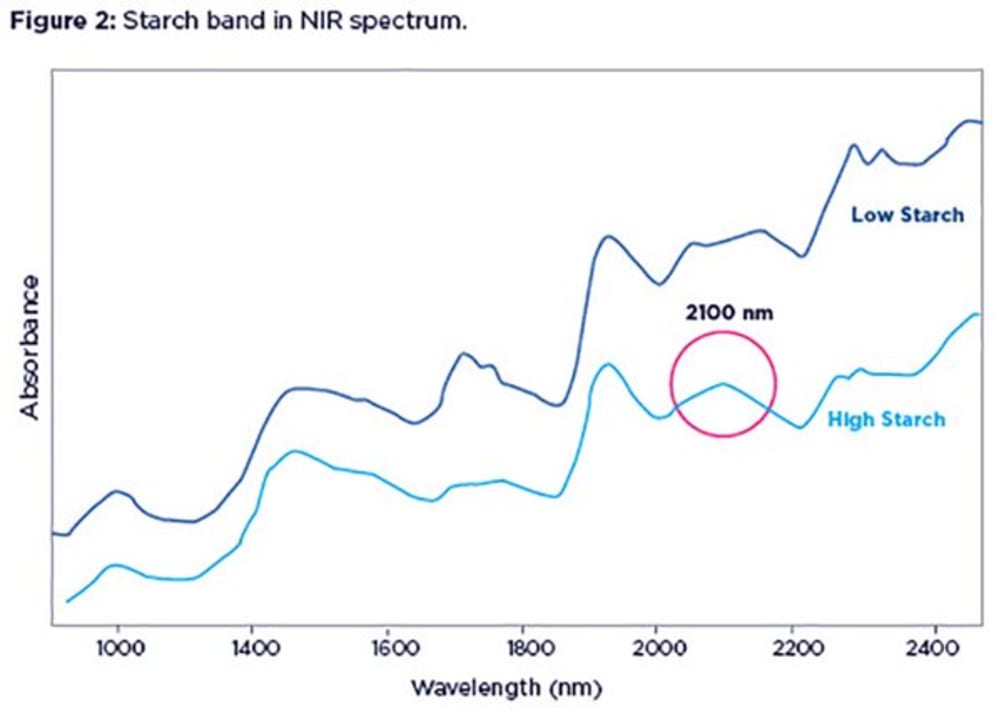
In many cases, it is fairly straightforward to spot a high starch content in your sample if you look carefully at its NIR spectrum. Figure 2 shows spectra from two feed samples, with low (1%, blue line) or high (60%, green line) starch contents.
The smooth bump around 2100 nm is where the starch band is located. Notice the dip created by the lack of starch in the blue spectrum, exposing protein shoulders on either side.
Section 3: Moisture
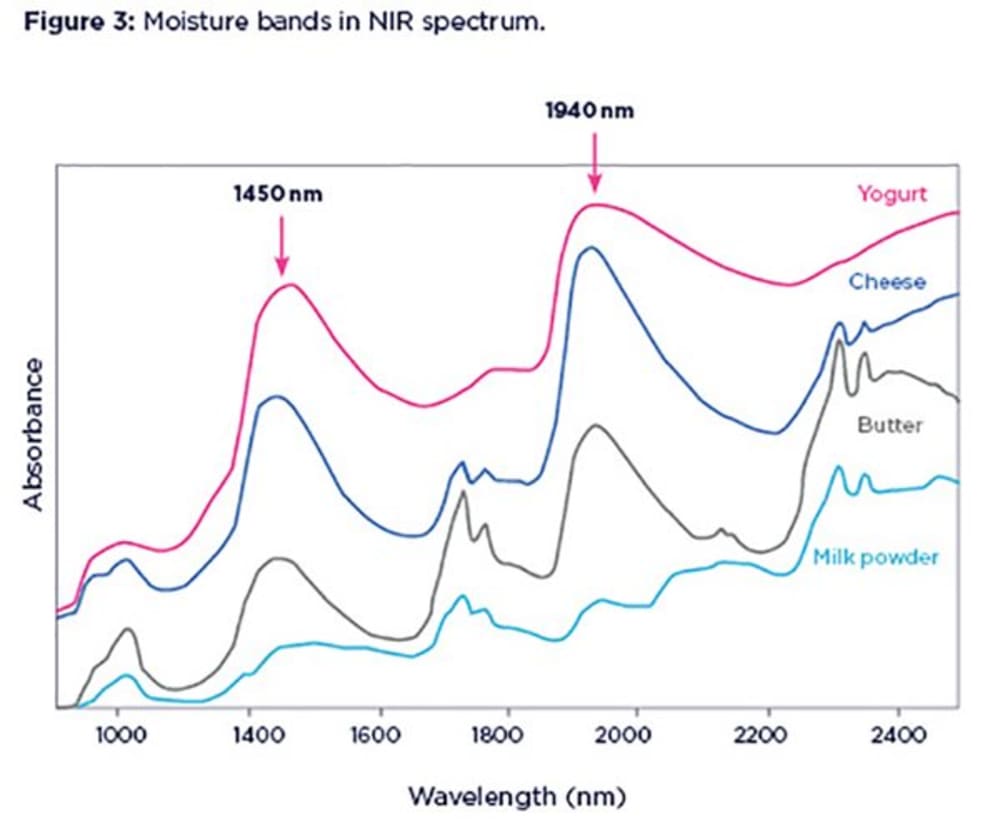
Water is the easiest of all components to spot in the NIR spectra, unless your sample is very dry. Water molecules absorb the NIR light more than any other chemical species. This makes NIR a sensitive tool for the measurement of moisture. Water absorption bands are such broad and dominant features in the NIR spectra that sometimes they can swamp or mask the information from other components.
Two main absorption bands from liquid water are located around 1450nm and 1940nm. Figure 3 shows spectra of different dairy products with different moisture content (powder, 2%; butter, 15%; cheese, 50%; yoghurt, 80%). Notice the enlargement and broadening of moisture bands as the water content increases in the samples.
Section 4: Protein
Although difficult to spot at lower concentrations, protein manifests itself as two distinctive bands, at 2050 and 2180nm. These can be on either side of the starch band at 2100nm, resembling shoulders. The proximity of the protein and starch bands can often cause problems in the interpretation of starch content, with changes in protein content confused with changes in starch content.
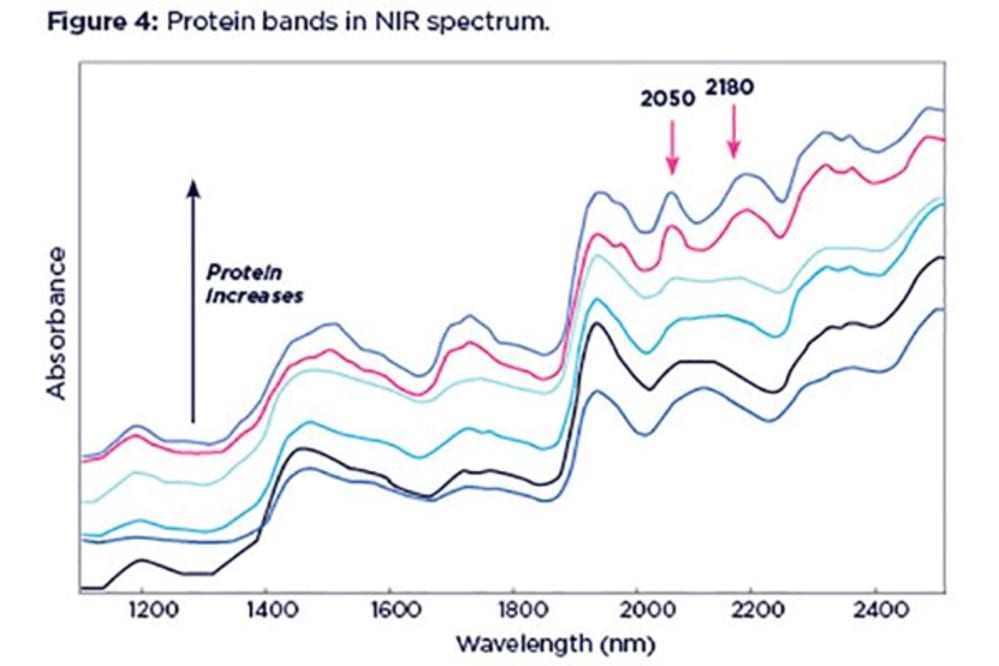
The above example shows a series of spectra with varying protein content, ranging from 10 to 60% and increasing from bottom to top. Starch content is consistent in all these spectra (~12%) although it appears to be changing. In this case, low starch content can be wrongly interpreted as high starch if protein content is also low, and high protein content can mask low starch content.
Thus, protein and starch need to be considered simultaneously in order to get an accurate prediction of both. This is one example why univariate (i.e. looking at one band only) analysis of NIR spectra can be misleading.
Section 5: Interpreting NIR spectra
It is important to highlight that, despite the characteristic peaks in NIR spectra, the interpretation is not as straightforward as it may seem due to the broad, overlapping and non-specific nature of their absorption bands. NIR bands are not related to any particular molecules (or chemical species). Rather they represent certain molecular bonds (mostly C-H, O-H and N-H). This means for example, any molecule with an N-H bond in its structure can potentially be confused with protein as it will overlap with NIR bands related to protein. Also, protein, oil and starch will all contribute to C-H bands at the same time.
This picture gets more complex when you notice that C-H, N-H and O-H bonds absorb in multiple locations in an NIR spectrum, in the form of overtones and combination bands. The spectrum is further complicated by the fact that C-H, N-H and O-H absorption bonds are pretty close to each other, as illustrated in Figure 5.
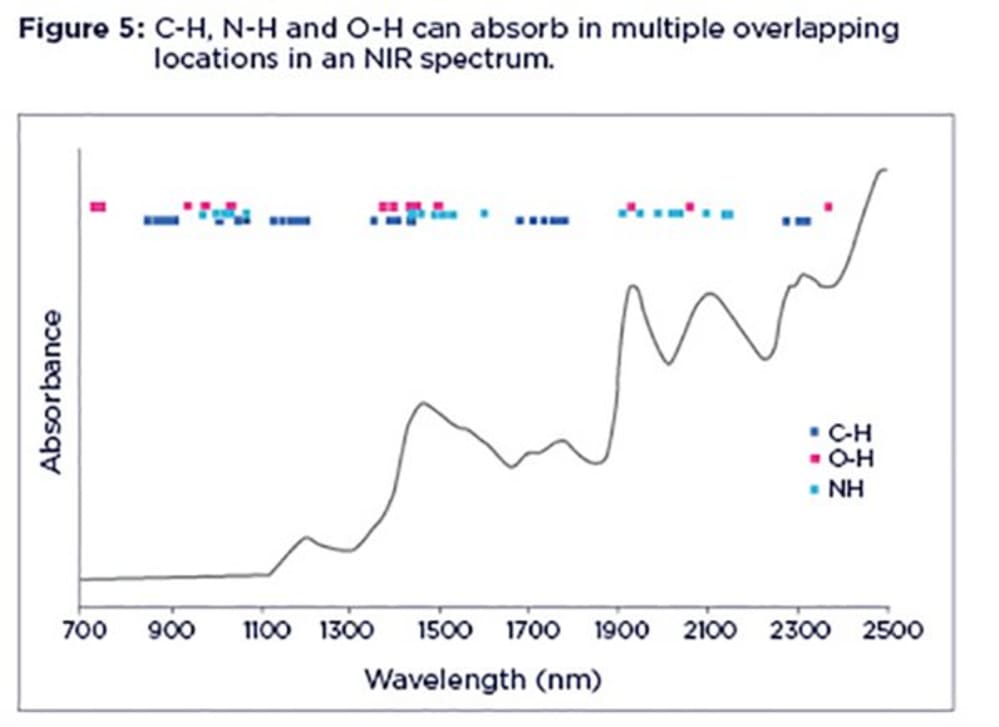
You only need to zoom in on any part of an NIR spectrum and you can't be totally sure what you are looking at as it can be any organic entity with N-H, O-H and C-H bonds in its structure. This is particularly true when dealing with feed samples containing lots of different organic components.
Section 6: Baseline shift
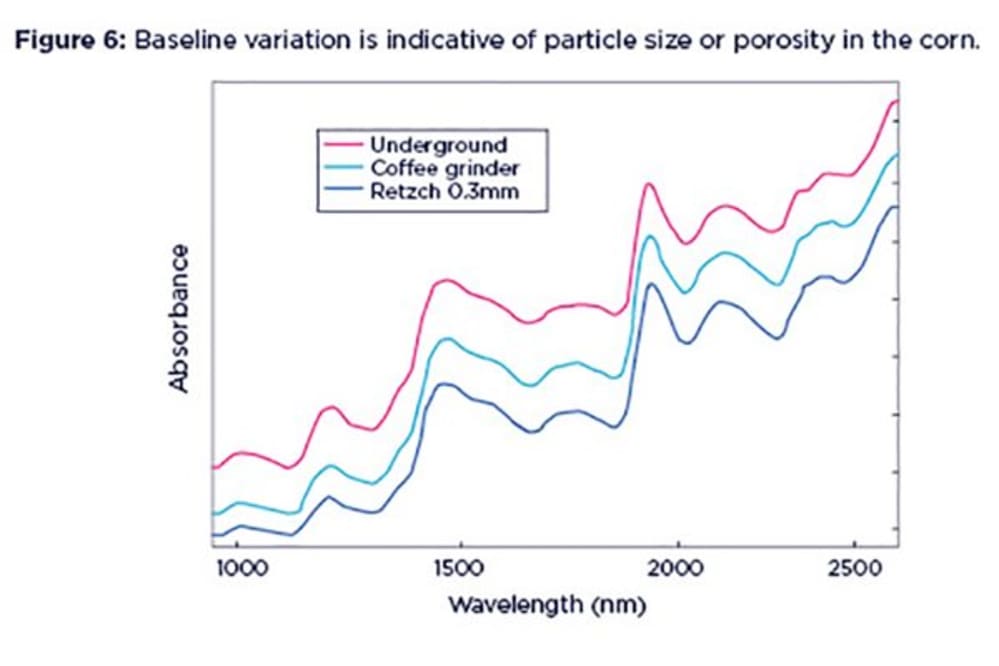
NIR spectra tell us about the chemical properties of the sample, and also reveal a great deal about the physical condition. One of the features of NIR spectra is that they often exhibit baseline shifts. This means that the spectra show an additive effect (i.e. is offset) along the absorption axis. This is usually indicative of variations due to particle size, packing density or porosity and even the presence of air bubbles.
This baseline shift is a very common feature. For example, if you scan sub-samples of the same sample multiple times you may see that the resulting spectra are not completely overlaying each other. This can happen when the particle size or porosity in the sample increases, allowing part of the NIR light that is shone on the sample to escape through the gaps between particles and hence to reach the instrument detector. This translates into a higher absorption baseline. This is called a ‘pseudo-absorbance’, to differentiate it from real chemical absorption by the sample.
In Figure 6 the whole (unground) corn spectra shows a relatively high baseline (red line). If we grind the sample with a coffee grinder, less light will escape through the sample gaps and reach the detector, hence the baseline shifts downwards (green line). Grinding the sample to a smaller particle size with a Retzch laboratory mill will cause the baseline to shift downwards even further, as shown by the blue line.
Baseline shifts are one of the reasons why pre-processing samples prior to taking NIR spectra is important. Pre-processing methods such as normalisation can minimise the physical variability in the spectra so that chemical information becomes more pronounced.
Latest news
Stay ahead with the latest news, ideas and events.

Online Feed Fibre Calculator
Calculate the percentage of dietary fibre in your feed
Our calculator is designed for nutritionists and uses averages of global raw materials to calculate the dietary fibre content (plus other more in-depth fibre parameters) of finished animal feed. These parameters are available within AB Vista’s Dietary Fibre analysis service (part of our NIR service).
Sign up for AB Vista news
A regular summary of our key stories sent straight to your inbox.
SUBSCRIBE
Woodstock Court, Blenheim Road, Business Park, Marlborough, Wiltshire, SN8 4AN
© AB Vista. All rights reserved 2025
Website T&Cs Privacy & Cookie Policy Terms & Conditions of Sale University IDC policy Speak Up Policy